2019独角兽企业重金招聘Python工程师标准>>> 
上一篇:【TeeChart .NET教程】(三)图表分页
下一篇:【TeeChart .NET教程】(五)图例设计
【下载TeeChart.Net最新版本】
TeeChart Pro将自动为用户定义所有Axis标签,并提供足够的灵活性来定制用户可能具有的任何特定要求。TeeChart Pro提供真正的多轴。它们可在设计或运行时使用,并为Axis定义提供无数可能性和灵活性,本教程将介绍轴控制的应用:
轴控制 - 关键领域
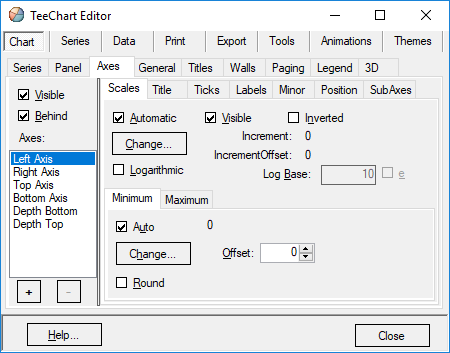
Scales——缩放
将系列数据添加到图表时,会自动设置轴刻度,用户可以使用Axis属性在设计时或运行时更改默认值。
Non date-time data——非日期时间数据
添加新系列时,TeeChart编辑器的Axis页面的Scales部分将显示Automatic selected和其他灰色选项。显示的所有值均为数字。

Date-time data——日期时间数据
当系列在Series(系列) —>General(常规)页面上将日期时间设置为true(对于该轴)时,TeeChart编辑器的轴页面的“Scales(缩放)”部分将显示“Auto(自动选定)”和其他灰色选项。值显示为日期时间值。
自动选择最佳轴刻度范围以适合用户的数据,在设计时使用TeeChart编辑器将线系列添加到图表,然后使用以下代码添加命令按钮:
[C#.Net]
Random rnd = new Random();
for(int i = 0; i <= 40; ++i)
line1.Add(Convert.ToDouble(i),rnd.Next(100),Color.Red);
[VB.Net]
Dim i As Integer
For i = 0 To 40
   Line1.Add(Convert.ToDouble(i), Rnd() * 100, Color.Red)
Next i
在按钮中运行代码将绘制一个包含40个随机值的Line Series。在设计时转到TeeChart编辑器,在“Axis(轴)”页面的“Bottom Axis scales(底轴刻度)”部分中,将“Auto(自动)”设置为“off'(关闭)”。现在可以配置轴刻度的最大值和最小值,再次运行代码将显示值,具体取决于用户为Axis配置的值,使用鼠标右键可以滚动查看剩余值。
按代码设置轴刻度:
更改最大值和最小值代码:
[C#.Net]
Steema.TeeChart.Axis bottomAxis = tChart1.Axes.Bottom;
bottomAxis.Automatic = false;
bottomAxis.Maximum = 36;
bottomAxis.Minimum = 5;
[VB.Net]
With TChart1.Axes.Bottom
   .Automatic = False
   .Maximum = 36
   .Minimum = 5
End With
将Axis scale Maximum和Minimum设置为自动代码:
[C#.Net]
Steema.TeeChart.Axis bottomAxis = tChart1.Axes.Bottom;
bottomAxis.AutomaticMaximum = true;
bottomAxis.AutomaticMinimum = false;
bottomAxis.Minimum = 5;
[VB.Net]
With TChart1.Axes.Bottom
   .AutomaticMaximum = True
   .AutomaticMinimum = False
   .Minimum = 5
End With
Increment——增量
用户可以自定义轴的间隔,从Axis页面的Scales部分选择Desired Increment组合框,并添加所需的增量,代码:
[C#.Net]
Steema.TeeChart.Axis bottomAxis = tChart1.Axes.Bottom;
bottomAxis.Increment = 20;
[VB.Net]
With TChart1.Axes.Bottom
   .Increment = 20
End With
Datetime data:日期型数据
如果数据是datetime(可以通过转到Series,General页面将数据设置为系列的datetime),Chart-> Axis页面的scale部分将显示日期时间范围。从Desired Increment组合框中显示的范围中选择增量,并添加一些样本数据:
[C#.Net]
Random rnd = new Random();
DateTime today = DateTime.Today;
TimeSpan oneDay = TimeSpan.FromDays(1);
line1.XValues.DateTime = true;
for(int i = 1; i <= 25; ++i)
     line1.Add(today,rnd.Next(100),Color.Red);
     today += oneDay;
[VB.Net]
Dim i As Integer
Dim Today As DateTime = DateTime.Today
Dim OneDay As TimeSpan = TimeSpan.FromDays(1)
Line1.XValues.DateTime = True
For i = 1 To 25
     Line1.Add(Today, Rnd() * 100, Color.Red)
     Today = Today.Add(OneDay)
Next
在运行时更改增量:
[C#.Net]
Steema.TeeChart.Axis bottomAxis = tChart1.Axes.Bottom;
bottomAxis.Increment = Steema.TeeChart.Utils.GetDateTimeStep(Steema.TeeChart.DateTimeSteps.TwoDays);
[VB.Net]
With TChart1.Axes.Bottom
   .Increment = Steema.TeeChart.Utils.GetDateTimeStep(Steema.TeeChart.DateTimeSteps.TwoDays)
End With
有关日期轴标签的更多信息,请参阅AxisLabels.ExactDateTime属性。
注意:
更改轴标签频率时,TeeChart将根据AxisLabels.Separation属性的设置避免标签重叠。这意味着如果标签频率太高而不适合标签,那么TeeChart将分配“最适合”。更改标签角度和标签分离是2个选项,可帮助用户安装所需的标签。
Titles——标题
标题设置在Axis页面的标题部分,用户可以更改Axis的标题文本及其字体和阴影属性,还可以指定标题文本的角度和大小。
注意:
更改轴标签频率时,TeeChart将根据AxisLabels.Separation属性的设置避免标签重叠。这意味着如果标签频率太高而不适合标签,那么TeeChart将分配“最适合”。更改标签角度和标签分离是2个选项,可帮助用户安装所需的标签。
标签格式:
用户可以将所有标准数字和日期格式应用于Axis标签。“Axis(轴)”页面的“Labels(标签)”部分包含“Values format(值格式)”字段。如果数据是datetime,则字段名称将更改为“Date time format”,在运行时使用代码:
[C#.Net]
tChart1.Axes.Bottom.Labels.ValueFormat = "#,##0.00;(#,##0.00)"; [VB.Net]
With TChart1.Axes.Bottom
   .Labels.ValueFormat = "#,##0.00;(#,##0.00)"
End With
或者用于日期时间数据
[C#.Net]
tChart1.Axes.Bottom.Labels.DateTimeFormat =“dddd / MMMM / yyyy”; [VB.Net]
With TChart1.Axes.Bottom
   .Labels.DateTimeFormat = "dddd/MMMM/yyyy"
End With
MultiLine标签
轴标签可以显示为多行文本而不是单行文本,使用LineSeparator字符()分隔行。
例:
[C#.Net]
bar1.Add(1234,“New”+ Steema.TeeChart.Texts.LineSeparator +“Cars”,Color.Red);
bar1.Add(2000,“Old”+ Steema.TeeChart.Texts.LineSeparator +“Bicycles”,Color.Red);
tChart1.Panel.MarginBottom = 10;
[VB.Net]
Bar1.Add(1234, "New" + Steema.TeeChart.Texts.LineSeparator + "Cars", Color.Red)
Bar1.Add(2000, "Old" + Steema.TeeChart.Texts.LineSeparator + "Bicycles", Color.Red)
TChart1.Panel.MarginBottom = 10
DateTime标签的示例:
以下将在两行文本中显示底部轴标签,一行显示月份和日期,第二行显示年份:
Feb-28 Mar-1 ..
2003 2003 ..
[C#.Net]
bar1.Add(DateTime.Parse(“28/2/2003”),100,Color.Red);
bar1.Add(DateTime.Parse(“1/3/2003”),200,Color.Red);
bar1.Add(DateTime.Parse(“2/3/2003”),150,Color.Red);
bar1.XValues.DateTime = true;
tChart1.Axes.Bottom.Labels.DateTimeFormat =“MM / dd hh:mm”;
tChart1.Axes.Bottom.Labels.MultiLine = true;
tChart1.Panel.MarginBottom = 10;
[VB.Net]
Bar1.Add(DateValue("28/2/2003"), 100, Color.Red)
Bar1.Add(DateValue("1/3/2003"), 200, Color.Red)
Bar1.Add(DateValue("2/3/2003"), 150, Color.Red)
Bar1.XValues.DateTime = True
TChart1.Axes.Bottom.Labels.DateTimeFormat = "MM/dd hh:mm"
TChart1.Axes.Bottom.Labels.MultiLine = True
TChart1.Panel.MarginBottom = 10
将AxisLabels.MultiLine属性设置为True将自动在有空格的行中拆分标签,有效地将Label分为两个:
第一行:'mm / dd'
第二行:'hh:mm'
在运行时始终可以使用OnGetAxisLabel事件以编程方式将标签拆分为多行:
[C#.Net]
private void tChart1_GetAxisLabel(object sender, Steema.TeeChart.TChart.GetAxisLabelEventArgs e)

            string myLabelText = e.LabelText;
            tChart1.Axes.Bottom.Labels.SplitInLines(ref myLabelText, " ");
            e.LabelText = myLabelText;
[VB.Net]
Private Sub TChart1_GetAxisLabel(ByVal sender As Object, ByVal e As Steema.TeeChart.TChart.GetAxisLabelEventArgs) Handles TChart1.GetAxisLabel
        Dim myLabelText As String
        myLabelText = e.LabelText
        TChart1.Axes.Bottom.Labels.SplitInLines(myLabelText, " ")
        e.LabelText = myLabelText
End Sub
在上面的示例中,全局“TeeSplitInLines”过程将“LabelText”中的所有空格转换为行分隔符(返回),轴AxisLabels.Angle属性也可用于多线轴标签。
Customising Axis labels——自定义轴标签
可以通过使用Axis事件获得进一步的Label控制。事件允许用户激活/停用/更改任何单个Axis标签。以下示例修改每个Label,将文本短语放在点索引值的前面:
[C#.Net]
private void button1_Click(object sender, System.EventArgs e)

            bar1.FillSampleValues(20);
            tChart1.Axes.Bottom.Labels.Style = AxisLabelStyle.Mark;


private void tChart1_GetAxisLabel(object sender, Steema.TeeChart.TChart.GetAxisLabelEventArgs e)

            if(((Steema.TeeChart.Axis)sender).Equals(tChart1.Axes.Bottom))
            e.LabelText = "Period " + Convert.ToString(e.ValueIndex);
[VB.Net]
Private Sub Button1_Click(ByVal sender As Object, ByVal e As System.EventArgs) Handles Button1.Click
        Bar1.FillSampleValues(20)
        TChart1.Axes.Bottom.Labels.Style = Steema.TeeChart.AxisLabelStyle.Mark
End Sub

Private Sub TChart1_GetAxisLabel(ByVal sender As Object, ByVal e As Steema.TeeChart.TChart.GetAxisLabelEventArgs) Handles TChart1.GetAxisLabel
        If CType(sender, Steema.TeeChart.Axis) Is TChart1.Axes.Bottom Then
            e.LabelText = "Period " & e.ValueIndex
        End If
End Sub
Logarithmic Labels——指数标签
正常对数标记可以通过以下方式设置:
[C#.Net]
private void button1_Click(object sender, System.EventArgs e)

            Random rnd = new Random();
            Steema.TeeChart.Axis leftAxis = tChart1.Axes.Left;
            tChart1.Aspect.View3D = false;
            bar1.Marks.Visible = false;
            for(int i = 0; i <= 100; ++i)
            bar1.Add(rnd.Next(100) * i);
            leftAxis.LogarithmicBase = 10;
            leftAxis.Logarithmic = true;
            leftAxis.SetMinMax(0, 10000);
            leftAxis.Labels.ValueFormat = "#e+0"; //exponential format
[VB.Net]
Private Sub Button1_Click(ByVal sender As Object, ByVal e As System.EventArgs) Handles Button1.Click
        Dim i As Integer
        TChart1.Aspect.View3D = False
        Bar1.Marks.Visible = False
        For i = 0 To 10000 Step 100
            Bar1.Add(Rnd() * i)
        Next
        With TChart1.Axes.Left
            .LogarithmicBase = 10
            .Logarithmic = True
            .SetMinMax(0, 10000)
            .Labels.ValueFormat = "#e+0" ' exponential format
        End With
End Sub
标签将根据对数基数(默认为10)进行设置,因此,在这种情况下给出标签为1,10,100,1000,10000。
Ticks and Minor——勾选和次要
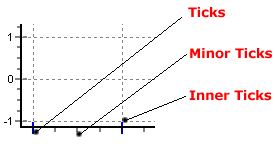
有3种勾选类型和2种类型的网格,用户可以更改每个刻度和网格类型的长度,宽度和颜色。可以通过“Ticks”选项卡对Ticks及其关联的Grid和Inner Ticks进行更改; 可以通过“Minor(次要)”选项卡更改次要刻度及其关联的网格。TeeChart Pro版本5的新功能是能够更改宽度大于1(默认值)的刻度和网格样式。
[C#.Net]
Steema.TeeChart.Axis bottomAxis = tChart1.Axes.Bottom;
bottomAxis.Ticks.Length = 7;
bottomAxis.Ticks.Color = Color.Green;
bottomAxis.MinorTickCount = 10;
[VB.Net]
With TChart1.Axes.Bottom
   .Ticks.Length = 7
   .Ticks.Color = Color.Green
   .MinorTickCount = 10
End With
Axis position——轴位置
轴具有修改每个轴所在位置的属性。在此示例中,轴移动了图表宽度的50%,因此它显示在图表中心:
[C#.Net]
Steema.TeeChart.Axis bottomAxis = tChart1.Axes.Bottom;
bottomAxis.PositionUnits = PositionUnits.Percent;
bottomAxis. RelativePosition = 50
[VB.Net]
With TChart1.Axes.Bottom
   .PositionUnits = PositionUnits.Percent
   .RelativePosition = 50
End With
Additional Axes——额外的轴
Copying axes——复制轴
TeeChart提供5个与数据相关的轴系列:Left(左),Top(上),Bottom(下),Right(右)和 Depth(深)。向图表添加新系列时,用户可以定义系列应与哪些轴相关(转到“Series(系列)”选项卡“General(常规)”页面),可以使用Axis Customdraw方法在图表上的任何位置重复前4轴中的任何一个(或全部)。此方法会复制Axis,但不会添加新的自定义轴。
例:
[C#.Net]
private void Form1_Load(object sender, System.EventArgs e)

            Random Rnd = new Random();
            tChart1.Aspect.View3D = false;
            tChart1.Panel.Gradient.Visible = true;
            for(int t = 0; t <= 20; ++t)
            line1.Add(t, ((Rnd.Next(100)) + 1) - ((Rnd.Next(70)) + 1), Color.Red);


private void line1_BeforeDrawValues(object sender, Steema.TeeChart.Drawing.Graphics3D g)

            int posAxis = 0;
            if(tChart1.Axes.Left.Maximum > 0)

                tChart1.Axes.Left.Draw(g.ChartXCenter - 10,g.ChartXCenter - 20,g.ChartXCenter,true);
                posAxis = tChart1.Axes.Left.CalcYPosValue(10);
                tChart1.Axes.Bottom.Draw(posAxis + 10, posAxis + 40, posAxis, true);
[VB.Net]
Private Sub Form1_Load(ByVal sender As System.Object, ByVal e As System.EventArgs) Handles MyBase.Load
        Dim t As Integer
        TChart1.Aspect.View3D = False
        TChart1.Panel.Gradient.Visible = True
        For t = 0 To 20
            Line1.Add(t, ((Rnd() * 100) + 1) - ((Rnd() * 70) + 1), Color.Red)
        Next
    End Sub

Private Sub Line1_BeforeDrawValues(ByVal sender As Object, ByVal g As Steema.TeeChart.Drawing.Graphics3D) Handles Line1.BeforeDrawValues
        Dim posAxis As Integer
        If TChart1.Axes.Left.Maximum > 0 Then
            TChart1.Axes.Left.Draw(g.ChartXCenter - 10, g.ChartXCenter - 20, g.ChartXCenter, True)
            posAxis = TChart1.Axes.Left.CalcYPosValue(10)
            TChart1.Axes.Bottom.Draw(posAxis + 10, posAxis + 40, posAxis, True)
        End If
End Sub
上面的示例代码将生成以下图像:
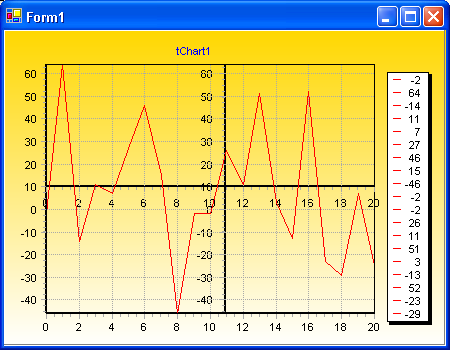
自定义轴
在此示例中,TeeChart将绘制新轴,一个水平,一个垂直位于图表的中心。当用户滚动图表(用鼠标右键拖动)时,新的垂直轴将始终保持在图表的中心,新的水平轴将垂直滚动上下移动,新轴是默认轴的精确副本。
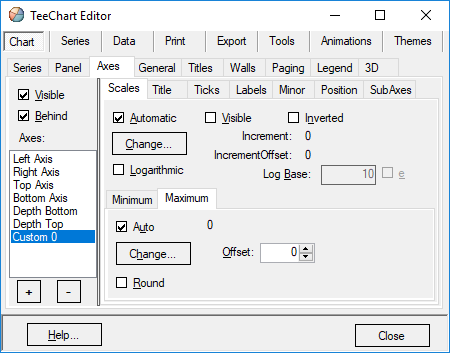
多个自定义轴
与PositionPercent和拉伸属性一起,可以使无限轴浮动到图表上的任何位置。滚动,缩放和轴命中检测也适用于自定义创建的轴。现在可以通过TeeChart Editor在设计时创建额外的轴,也可以在运行时通过几行代码创建额外的轴:
通过图表编辑器
TeeChart为用户提供在设计时创建自定义轴的功能,使其能够以TeeChart的T恤文件格式保存。打开图表编辑器并单击“Axis(轴)”选项卡,然后选择“+”按钮以添加自定义轴。然后选择“Position(位置)”选项卡,确保突出显示新的自定义轴。此页面上的“ Horizontal(水平)”复选框允许用户将新的自定义轴定义为水平轴或将其保留为默认垂直轴。如上所述,此页面的其余部分和Axis页面中的其他选项卡可用于更改自定义轴的比例,增量,标题,标签,刻度,次刻度和位置。要将此新的自定义轴与所需的数据系列相关联,请选择“Series(系列)”选项卡,然后转到“General(常规)”页面,其中下拉组合框“Horizontal Axis(水平轴)”和“Vertical Axis(垂直轴)”将允许用户选择新的自定义轴,具体取决于用户之前是将其定义为垂直轴还是水平轴。
代码:
[C#.Net]
private void Form1_Load(object sender, System.EventArgs e)

            Line line1 = new Line();
            Line line2 = new Line();

            tChart1.Aspect.View3D = false;
            tChart1.Panel.Gradient.Visible = true;
            tChart1.Header.Text = "TeeChart Multiple Axes";
            tChart1.Series.Add(line1);
            tChart1.Series.Add(line2);

            for(int t = 0; t <= 10; ++t)

                line1.Add(Convert.ToDouble(t), Convert.ToDouble(10 + t), Color.Red);
                if(t > 1)
                line2.Add(Convert.ToDouble(t), Convert.ToDouble(t), Color.Green);


            Axis leftAxis = tChart1.Axes.Left;

            leftAxis.StartPosition = 0;
            leftAxis.EndPosition = 50;
            leftAxis.AxisPen.Color = Color.Red;
            leftAxis.Title.Font.Color = Color.Red;
            leftAxis.Title.Font.Bold = true;
            leftAxis.Title.Text = "1st Left Axis";

//            You are able to then position the new Axis in overall relation to the Chart
//            by using the StartPosition and EndPosition  properties.
//
//            StartPosition=50
//            EndPosition=100
//
//            These figures are expressed as percentages of the Chart Rectangle with 0 (zero)
//            (in the case of a vertical Axis) being Top. These properties can be applied to
//            the Standard Axes to create completely partitioned 'SubCharts' within the Chart.

            Axis axis1 = new Axis(false, false, tChart1.Chart);

            tChart1.Axes.Custom.Add(axis1);

            line2.CustomVertAxis = axis1;

            axis1.StartPosition = 50;
            axis1.EndPosition = 100;
            axis1.AxisPen.Color = Color.Green;
            axis1.Title.Font.Color = Color.Green;
            axis1.Title.Font.Bold = true;
            axis1.Title.Text = "Extra Axis";
            axis1.PositionUnits= PositionUnits.Percent;
            axis1.RelativePosition = 20;
[VB.Net]
Private Sub Form1_Load(ByVal sender As System.Object, ByVal e As System.EventArgs) Handles MyBase.Load
        Dim Line1 As New Steema.TeeChart.Styles.Line()
        Dim Line2 As New Steema.TeeChart.Styles.Line()
        Dim t As Integer

        TChart1.Aspect.View3D = False
        TChart1.Panel.Gradient.Visible = True
        TChart1.Header.Text = "TeeChart Multiple Axes"
        TChart1.Series.Add(Line1)
        TChart1.Series.Add(Line2)

        For t = 0 To 10
            Line1.Add(t, 10 + t, Color.Red)
            If (t > 1) Then
                Line2.Add(t, t, Color.Green)
            End If
        Next

        With TChart1.Axes.Left
            .StartPosition = 0
            .EndPosition = 50
            .AxisPen.Color = Color.Red
            .Title.Font.Color = Color.Red
            .Title.Font.Bold = True
            .Title.Text = "1st Left Axis"
        End With

        'You are able to then position the new Axis in overall relation to the Chart
        'by using the StartPosition and EndPosition  properties.

        '      StartPosition = 50
        '      EndPosition = 100

        'These figures are expressed as percentages of the Chart Rectangle with 0 (zero)
        '(in the case of a vertical Axis) being Top. These properties can be applied to
        'the Standard Axes to create completely partitioned 'SubCharts' within the Chart.

        Dim Axis1 As New Steema.TeeChart.Axis(False, False, TChart1.Chart)

        TChart1.Axes.Custom.Add(Axis1)

        Line2.CustomVertAxis = Axis1

        Axis1.StartPosition = 50
        Axis1.EndPosition = 100
        Axis1.AxisPen.Color = Color.Green
        Axis1.Title.Font.Color = Color.Green
        Axis1.Title.Font.Bold = True
        Axis1.Title.Text = "Extra Axis"
        Axis1.PositionUnits.=  PositionUnits.Percent;
        Axis1.RelativePosition = 20
End Sub
上面的编码示例将显示以下图表:
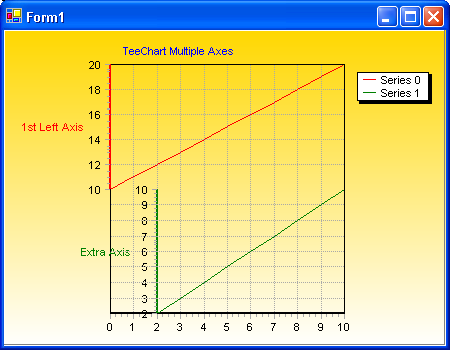
Multiple axes——多轴
选项是无限的!建议在使用自定义轴时要小心,因为很容易开始用新轴填充屏幕并且无法跟踪用户想要管理的轴!
轴心事件
Axis事件提供运行时灵活性,可以修改Axis标签并在Axis Clicks上显示用户交互性。
OnClickAxis
请参阅OnClickAxis事件。
例
[C#.Net]
private void tChart1_ClickAxis(object sender, System.Windows.Forms.MouseEventArgs e)

            if(((Steema.TeeChart.Axis)sender).Equals(tChart1.Axes.Bottom))

                MessageBox.Show("Clicked Bottom Axis at: " + line1.XScreenToValue(e.X));
[VB.Net]
Private Sub TChart1_ClickAxis(ByVal sender As Object, ByVal e As System.Windows.Forms.MouseEventArgs) Handles TChart1.ClickAxis
        If CType(sender, Steema.TeeChart.Axis) Is TChart1.Axes.Bottom Then
            MsgBox("Clicked Bottom Axis at: " & Line1.XScreenToValue(e.X))
        End If
End Sub
OnGetAxisLabel
可用于修改Axis标签。
例
[C#.Net]
private void button1_Click(object sender,System.EventArgs e)

            bar1.FillSampleValues(20);
            tChart1.Axes.Bottom.Labels.Style = AxisLabelStyle.Mark;


private void tChart1_GetAxisLabel(object sender,Steema.TeeChart.TChart.GetAxisLabelEventArgs e)

            if(((Steema.TeeChart.Axis)sender).Equals(tChart1.Axes.Bottom))
            e.LabelText =“Period”+ Convert.ToString( e.ValueIndex);
[VB.Net]
Private Sub Button1_Click(ByVal sender As Object, ByVal e As System.EventArgs) Handles Button1.Click
        Bar1.FillSampleValues(20)
        TChart1.Axes.Bottom.Labels.Style = Steema.TeeChart.AxisLabelStyle.Mark
End Sub

Private Sub TChart1_GetAxisLabel(ByVal sender As Object, ByVal e As Steema.TeeChart.TChart.GetAxisLabelEventArgs) Handles TChart1.GetAxisLabel
        If CType(sender, Steema.TeeChart.Axis) Is TChart1.Axes.Bottom Then
            e.LabelText = "Period " & e.ValueIndex
        End If
End Sub
OnGetNextAxisLabel
可用于决定应显示哪些轴标签,使用e.Stop布尔属性来包含/排除轴标签。
例
[C#.Net]
private void Form1_Load(object sender, System.EventArgs e)

            line1.FillSampleValues(20);


private void tChart1_GetNextAxisLabel(object sender, Steema.TeeChart.TChart.GetNextAxisLabelEventArgs e)

            if(((Steema.TeeChart.Axis)sender).Equals(tChart1.Axes.Bottom))

                e.Stop = false;
                switch(e.LabelIndex)

                    case 0: e.LabelValue = 5; break;
                    case 1: e.LabelValue = 13; break;
                    case 2: e.LabelValue = 19; break;
                    default: e.Stop = true; break;
[VB.Net]
Private Sub Form1_Load(ByVal sender As System.Object, ByVal e As System.EventArgs) Handles MyBase.Load
        Line1.FillSampleValues(20)
End Sub

Private Sub TChart1_GetNextAxisLabel(ByVal sender As Object, ByVal e As Steema.TeeChart.TChart.GetNextAxisLabelEventArgs) Handles TChart1.GetNextAxisLabel
        If CType(sender, Steema.TeeChart.Axis) Is TChart1.Axes.Bottom Then
            e.Stop = False
            Select Case e.LabelIndex
                Case 0 : e.LabelValue = 5
                Case 1 : e.LabelValue = 13
                Case 2 : e.LabelValue = 19
                Case Else : e.Stop = True
            End Select
        End If
End Sub